General and specialty contractors have upped the ante in the past few years when it comes to technology spending. After many years of putting new deployments and upgrades on the back burner, firms have renewed their focus on leveraging applications and powerful compute resources to help them run their businesses more efficiently.
As reported by Jobsite.com, when Software Connect published its Construction Technology Trends report, the organization asked construction professionals about their future plans for implementing new technologies. A staggering 81% said they planned to spend more on technology in 2018 than in 2017.
If your construction firm is at the point where you’ve just deployed or upgraded to new IT systems, now’s the time to consider “going the last mile” by bringing business intelligence (BI) into the mix. There’s likely a lot more KPI data available now that you did not have access to before. It only makes sense to analyze that data to further improve operational efficiencies and guide your strategy on the future direction of your company.
The need to deploy BI solutions that enable businesses to run more efficiently has grown acute in recent years with the increased margin pressure that all construction companies are feeling. The challenges come from trying to aggregate all that data (which might be stored in multiple systems running in both the cloud and on-premises) and then bringing it all into one data warehouse.
From there, the data needs to be transformed so that numbers from job-costing, for example, can be integrated with numbers from payroll. Once all the data from the multiple systems is normalized, it can then be presented in easily-consumed dashboards that allow management to quickly assess situations and confirm project status in real time. They can then make informed decisions on how to react to the information.
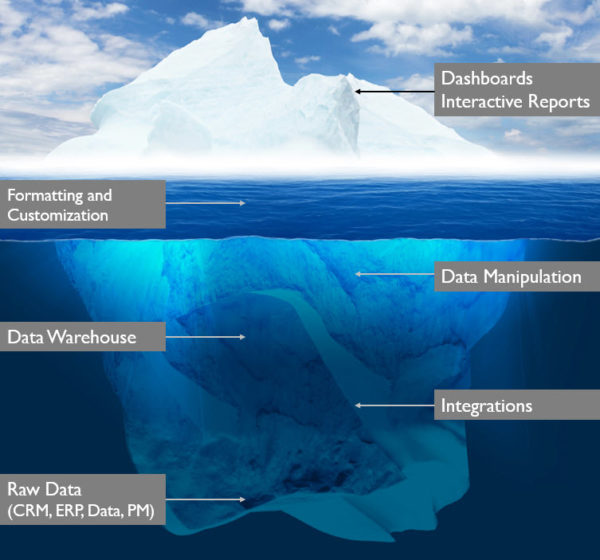
A major factor in solving this challenge lies in the set of resources and expertise you utilize. Most large construction operations and some medium firms already employ technical and functional analysts who they can turn to in order to determine the required data and the workflows that need to occur for the data to get into the data warehouse. But many firms then make the mistake of thinking it’s just a matter of purchasing a BI tool with a slick dashboard.
That’s just the tip of the iceberg, perhaps 20% of the overall task of a successful BI implementation. The other 80% comes from knowing how to integrate all the back-end systems with the data warehouse and how to convert the data into the right format so it can be delivered to the dashboards. This takes specific technology expertise that’s often not part of the skillset of internal IT teams at construction firms. They most likely need to work with an external partner.
The payoffs of finding the right partner to help you deploy a successful BI implementation are huge. You get tighter management over project budgets as well as improved management over labor activities and costs. By aggregating data from payroll, your job-cost system and sales forecasts, you can move beyond just knowing how many resources are on a job and how many days it will take to complete the project.
Many of our construction clients are using next-level KPIs to monitor backlogs, WIP, change orders, buyouts, labor forecasts, project and customer margins, net income, and other financial benchmarks. Service companies can then add another layer by monitoring contractor profitability, zone analysis, technician efficiency, service-call close rates, and predictive analysis of equipment failure rates.
The leading BI solutions, when integrated with back-end systems that are working properly, deliver all this information in real time. That means you can react to business performance results when there’s still time to correct problem situations—not one month later when it may be too late to mitigate issues.
BI also gives you the ability to establish benchmark metrics against which actual performance can be compared. That way, you can see if you actually moved the needle in the right direction during the past month, quarter and year; you can also look ahead to forecast what will happen in the future.
Companies putting this infrastructure in place today gain the benefits of these descriptive measures of their performance while adding the ability to perform predictive analysis to proactively lead their businesses past the competition. This same framework will also allow them to integrate data from IoT-connected field devices such as equipment monitors.
Another key benefit of the leading BI tools is that the dashboards can be tailored according to the information needed by each individual role within your company. This includes views for the CEO and the CFO as well as the head of construction, project managers, and site supervisors. The dashboards can give each person their own unique view of high-level KPIs along with the ability to drill down into the details behind each KPI to investigate variances and anomalies
As an example, one of our construction clients recently used BI to analyze variabilities in supplier pricing and inventory usage. This allowed them to negotiate better terms and implement tighter inventory controls. They also picked up three points on their cost of materials, saving the organization over $250K per year.
In another case, the client discovered variability in labor productivity by service technicians and geographic zones caused by neighborhood traffic patterns. This made it possible to make scheduling changes to improve margins, resulting in a 5% increase in labor productivity in a single quarter for the underperforming zones.
These cases demonstrate how the high-level and detailed views presented by BI dashboards are very easy to interpret in comparison to hard-to-read spreadsheets—where it’s difficult tell what is important and often require end-users to manipulate the information through sorting multiple columns and running macros. By contrast, dashboards handle all this behind the scenes, and they provide drop-down menus to get at all the information you need—right at your fingertips!